How to stop using console.log() and start using your browser’s debugger
Parag Zaveri
19 Dec 2022
•
5 min read

When I started my journey to become a software developer, I definitely ran into my fair share of bumps in the road. One of the most common struggles that most new developers face is debugging. At first, I thought I discovered the holy grail when I realized that I could open the console in chrome and console.log() out my values to discover where my bugs were. This turned out to be highly inefficient. For the sake of humor, here are a couple of my favorite use cases:
console.log(‘Total Price:’, total) //In an effort to see if the value was stored
console.log(‘Here’) //If my program execution reached a certain function
I think most developers begin to realize that this is NOT how you are actually supposed to debug your programs. There has to be a better way!
Well thankfully there is, your browser’s debugging tools. Specifically, I will discuss the Chrome Developer Tools.
In this post, I will cover using breakpoints, stepping through your code, setting watch expressions, and applying your fixes in Chrome Developer Tools.
In order to follow along with this tutorial, you will need to use a sample repository of code that I created. Click here. (May Take A Minute To Load)
Step 1: Reproduce The Bug
We start by executing a series of actions that consistently reproduce the bug.
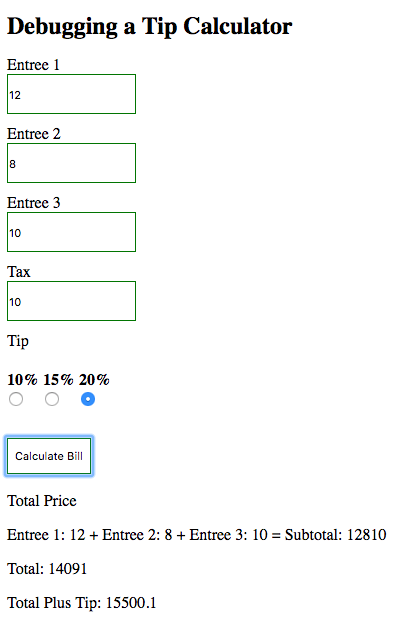
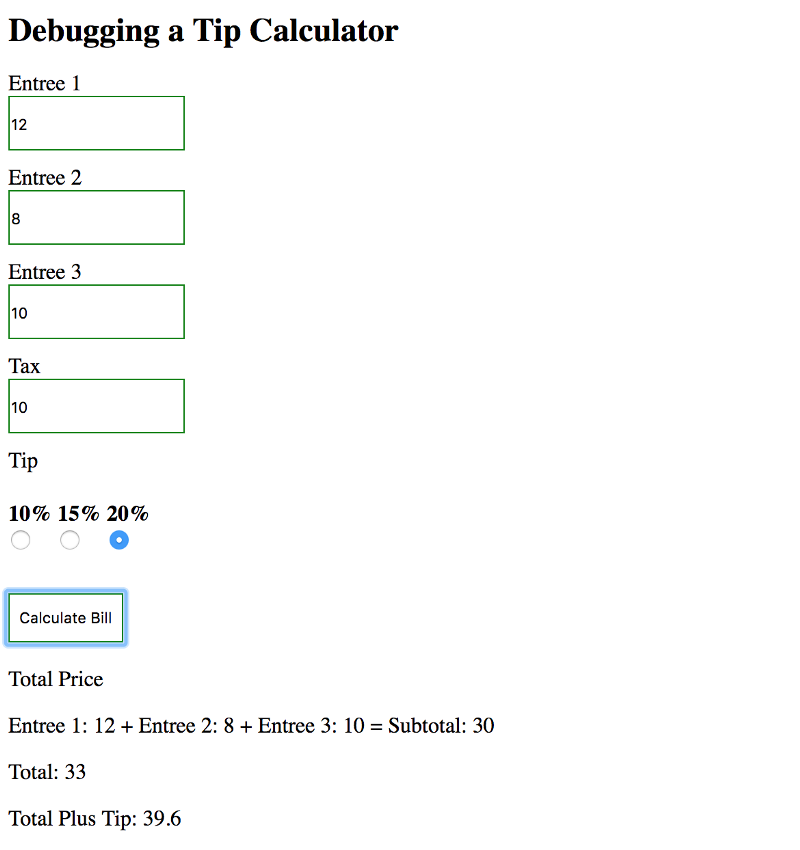
- In our case we will be using a buggy tip calculator. If you haven’t opened the sample code. Please do so here.
- Enter 12 for ‘Entree 1’
- Enter 8 for ‘Entree 2’
- Enter 10 for ‘Entree 3’
- Enter 10 for ‘Tax’
- Choose 20% for ‘Tip’
- Click Calculate Bill. The total should be 39.6, however we get a much different result. Instead, it appears we have 14105.09…yikes!
Step 2: Learn To Use Sources Panel
In order to debug this in Chrome, you need to get used to using DevTools. To open Chrome Developer Tools, press Command+Option+I (Mac) or Control+Shift+I (Linux).
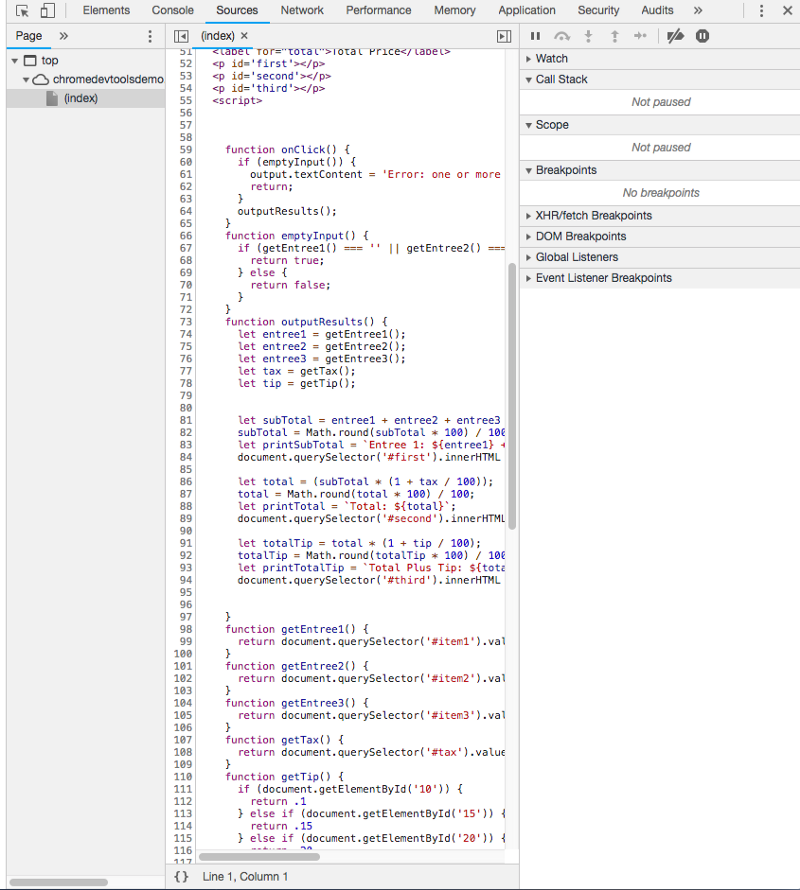
After clicking on the sources panel at the top, you should have access to three panels for debugging. The file navigator, the source code editor, and the debugging pane. Click around and have some fun before moving on to step 3.
Step 3: Setting Your First Breakpoint
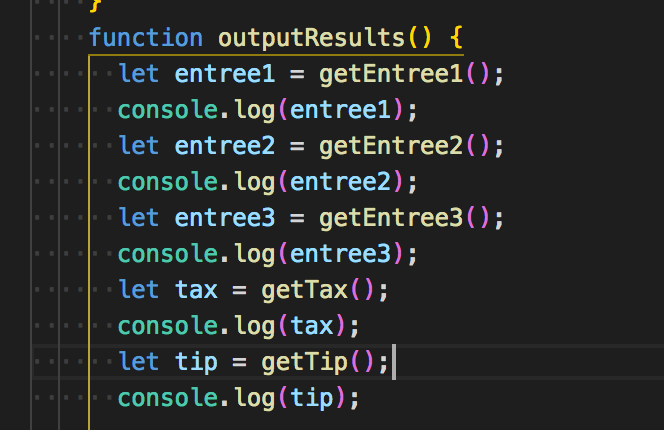
Before showing you how to set your first breakpoint, let me first demonstrate what I mean by the use of console.log(). Clearly, in our program’s execution, something is going on with the calculation of the subtotal. One may debug the program by doing something like this:
Luckily, this is no longer necessary with the dev tools in your browser. Instead we can simply set a breakpoint and step through our code to find the values as the browser sees it.
Let’s talk about how to set a breakpoint. A breakpoint is something that your browser looks for in order to know when to pause execution of your code and allow you the opportunity to debug it.
For our purposes, we will be setting a breakpoint at the very beginning of the execution of the program by setting a mouse event.
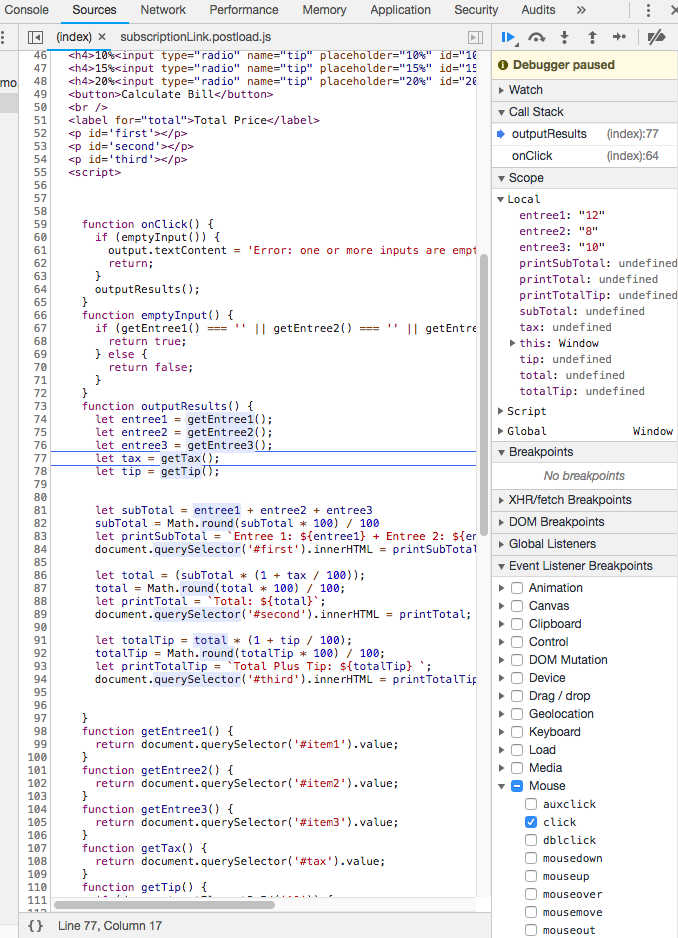
On the debugger pane expand the view of the “Event Listener Breakpoints”. From there, expand “Mouse”. Then checkmark the ‘click’ button.
Now when you click the Calculate Bill button, the debugger will pause execution on the first line of the first function onClick(). If the debugger is anywhere else, push the play button and the debugger will skip over to it.
Step 4: Stepping Through Your Code
In all debugging tools, the user has two options with navigation through the execution of the code. The user can either “step into” or “step over” the next function call.
Step into will allow for each line of code to executed one by one inside of each function.

Step over will allow for skipping over entire functions that are known to be working.

Here is an example of me stepping through my code. Under the scope tab, my values for the first three entrees are display on the right.
Step 5: Set A Line-of-Code Breakpoint
Wow! Being able to step through your code is amazing, but kinda bulky and cumbersome right? Normally, I only want to know the values at certain locations. Well the solution for that problem, is the line-of-code breakpoint.
Authors Note: The line-of-code breakpoint was THE reason why I’ve stopped using console.log() in favor of Chrome Developer Tools
In order to set a line-of-code breakpoint, simply click on the line number that you would like to see more information about. Then run your code as usual and execution will stop on your set line-of-code breakpoint as opposed to needing to step through or over every function.
Note: If you are having trouble, make sure you’ve de-selected the click checkbox under mouse.
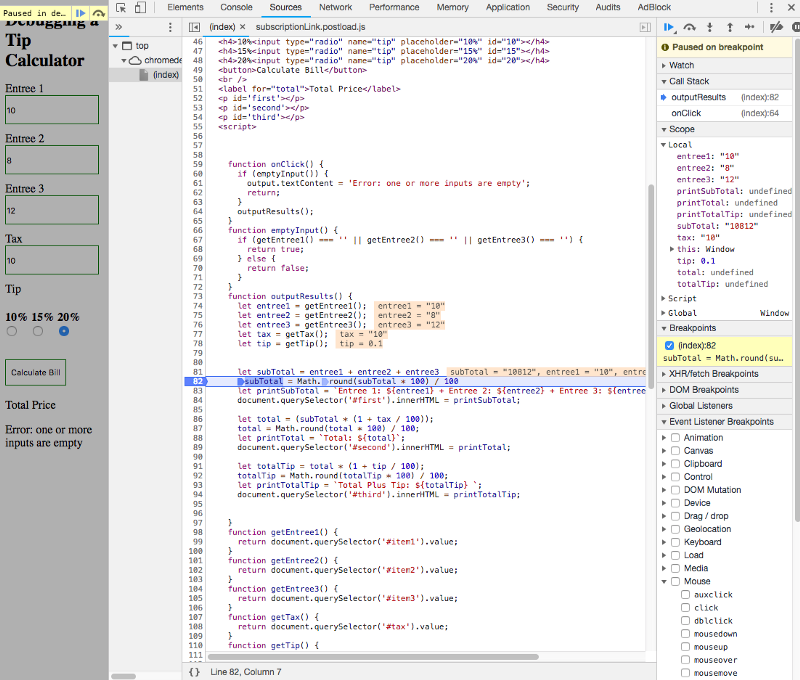
As you can see, my subtotal value is shown as I requested to a value of “10812”. My entree values are also displaying in the scope pane and as an overlay on the code itself.
Hmm…I think I may have figured out the bug. String concatenation anyone?
Let’s set some watch expressions to make sure though.
Step 6: Create Watch Expressions
Well now that we know that our entree values are not adding together properly, let’s set a watch expression on each of those values.
A watch expression will give more information on any given variable or expression in your code.
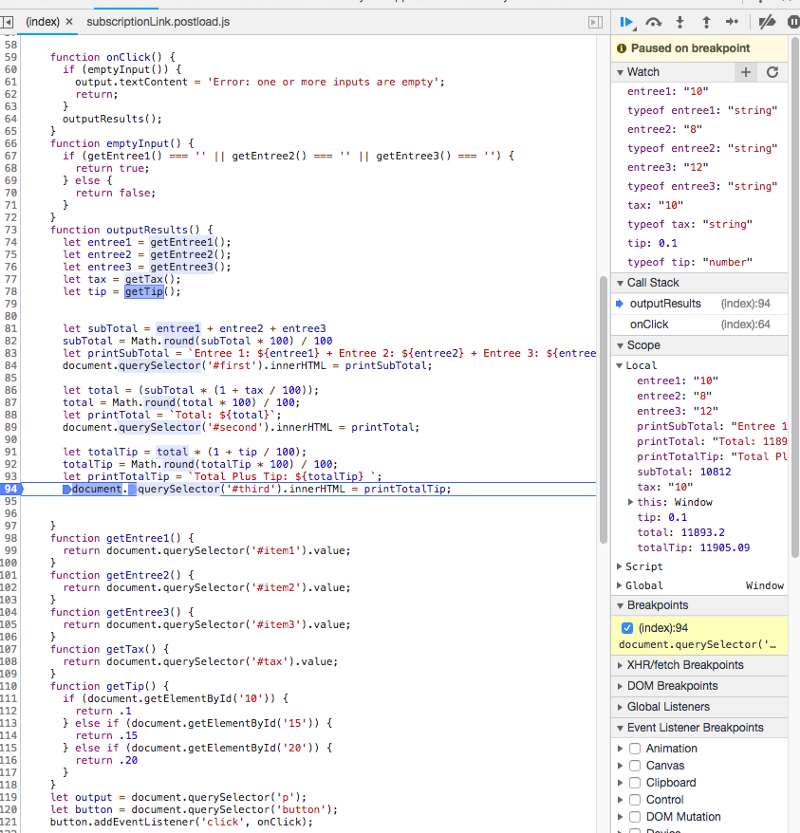
To define values to ‘watch’, click on the watch pane at the very top and click the + symbol once it opens. Here, you can type in variable names or other expressions.
For the demo, I will be setting a watch on my first entree value and the type of that entree value.
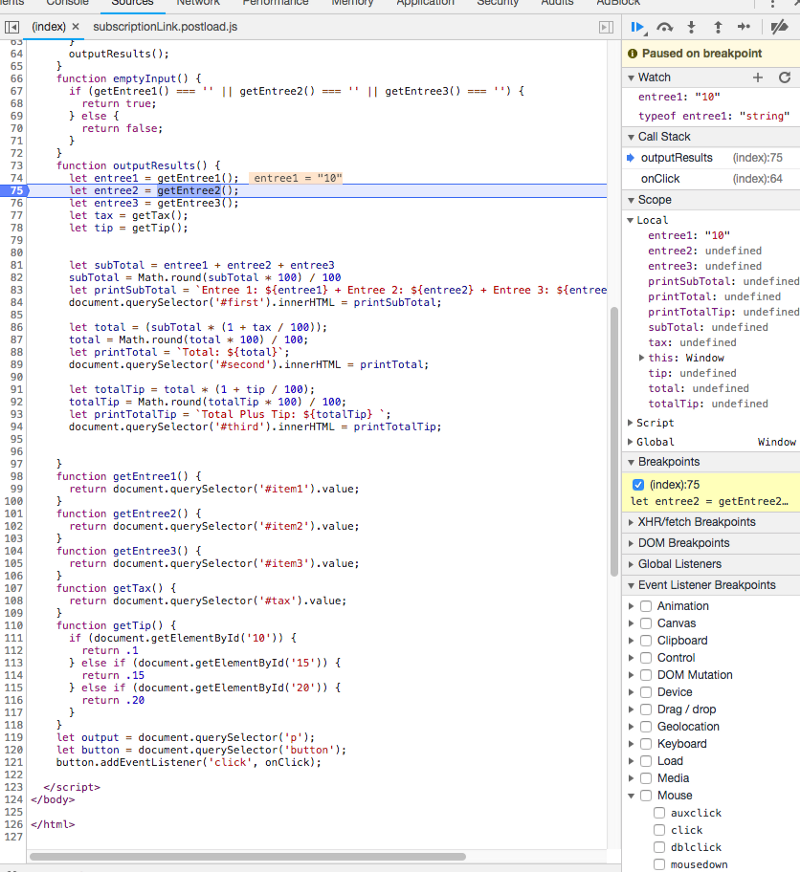
Aha! I think I’ve found the problem. It appears that my first entree is stored as a string! It seems to be coming from how I acquire the value itself. Perhaps, querySelector() is the culprit. Several other values may be effected as well. Let’s debug further then move into fixing our code in DevTools.
Step 7: Fix Your Code
Upon further review, querySelector() is definitely the culprit!
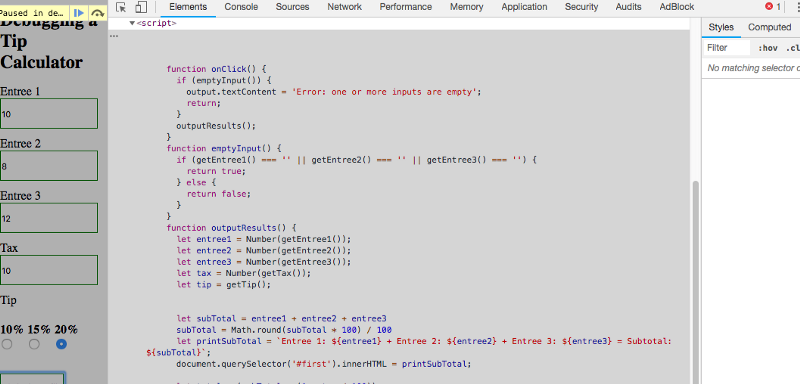
So how do we fix this? Well we can simply coerce the strings into number values using, for example, Number(getEntree1()) as in line 74.
In order to actually edit the code, you will need to go the ‘elements’ panel left of ‘sources’. If you cannot see the javascript code, then you need to expand on the script tag. From there, right click on the code and select ‘edit as html’.
If you are using a workspace, saving the code will be easy and viewable instantly. If not, you will need to save a local copy of the webpage using command+s (mac) or control+s (linux).
From there you can open your local copy and view the changes.

WorksHub
Jobs
Locations
Articles
Ground Floor, Verse Building, 18 Brunswick Place, London, N1 6DZ
108 E 16th Street, New York, NY 10003
Subscribe to our newsletter
Join over 111,000 others and get access to exclusive content, job opportunities and more!